Personal Profiles
Have you played one of our simulation games? If so, you’ve already experienced how every decision you make shapes the outcome and reveals something unique about your approach.
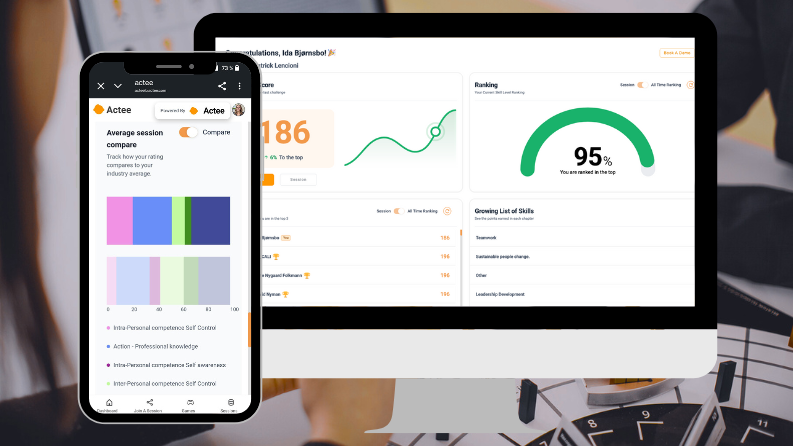
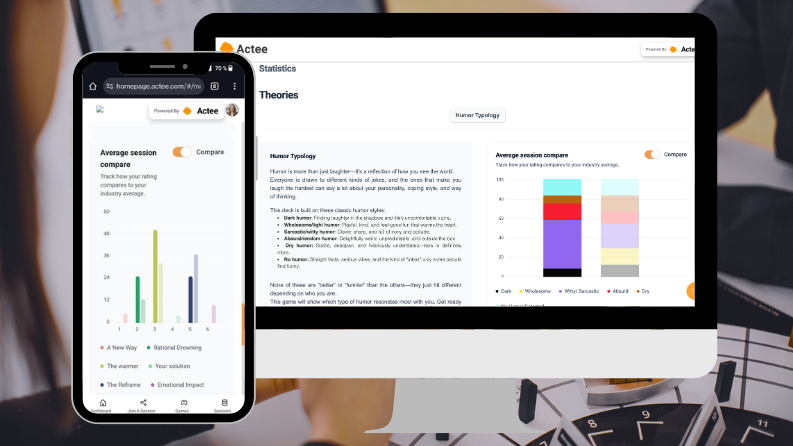
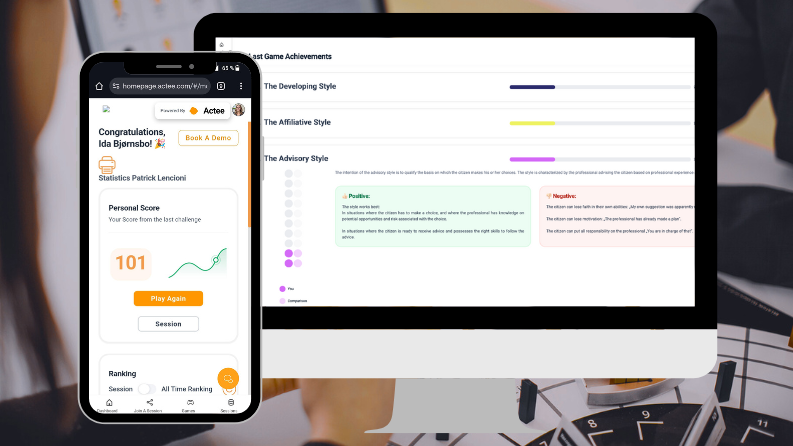
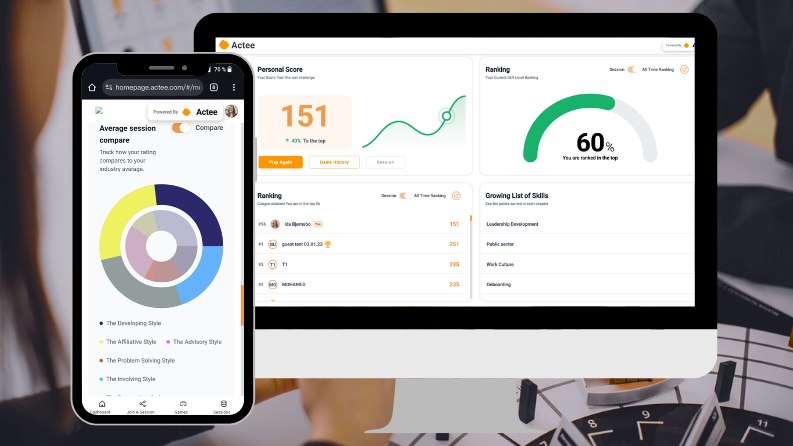
Our Personal Profiles feature goes beyond a simple summary. It provides deep insights into how you handle challenges, highlighting your strengths and areas for growth. With our advanced data tools, you gain a clearer understanding of your decision-making patterns, helping you enhance your skills, refine your strategies, and get the most out of every game experience.
The Data Module
From Data to Insights
Key Benefits for Facilitators
-
Offers a basis for personalised feedback and development plans
-
Encourages self-awareness and continuous improvement
-
Supports targeted coaching and mentoring efforts
How to Use Actee Personal Profiles
Choose from a wide range of ready-made games and theory layers, or use our GameBuilder to create your own. Start from scratch or get AI-assisted suggestions — with Actee, your imagination is the only limit.
-
Face-to-Face: Discuss profiles in one-on-one or group settings; integrate into development plans
-
Virtual: Share profiles digitally; schedule virtual feedback sessions
For Players
Every time you play one of our simulation games, your choices are tracked and consolidated into your personal profile. The data highlights your theoretical preferences, showing which approaches you naturally lean toward and which areas may need more attention. Over time, this helps you build awareness of your own style and develop stronger leadership and communication skills.
For Facilitators
You gain access to individual and cohort data, benchmark statistics, and industry comparisons. These insights transform Personal Profiles into a powerful strategic tool for L&D, enabling you to design targeted interventions and meaningful discussions that elevate learning outcomes.
Your Contribution
Every decision you make adds to your profile and contributes to a growing dataset of millions of choices collected since 2010. This allows both individuals and organisations to benchmark themselves against peers, industries, and global trends.
What You Gain
-
Personal Profiles: Insights into your decision-making patterns, strengths, and blind spots.
-
Top Scores: Track your performance, compare results with peers, and spark discussion in workshops.
-
Industry Comparisons: Explore differences across sectors in leadership vs. management approaches.
-
Company Subscription Features: Measure and benchmark sessions within your own organisation or industry, and use collective profiles to guide strategic L&D decisions.
-
For Consultancies: Facilitate post-workshop discussions, compare group results, and uncover differences in theoretical approaches across departments or organisations.
With Personal Profiles, every game becomes a mirror — reflecting how you think, decide, and lead.
Get a Demo


